Projected Balance Calculator Pt Deux
I updated the balance projection calculator thingy a week or so ago but I thought I'd write about it. Here's a demo image:
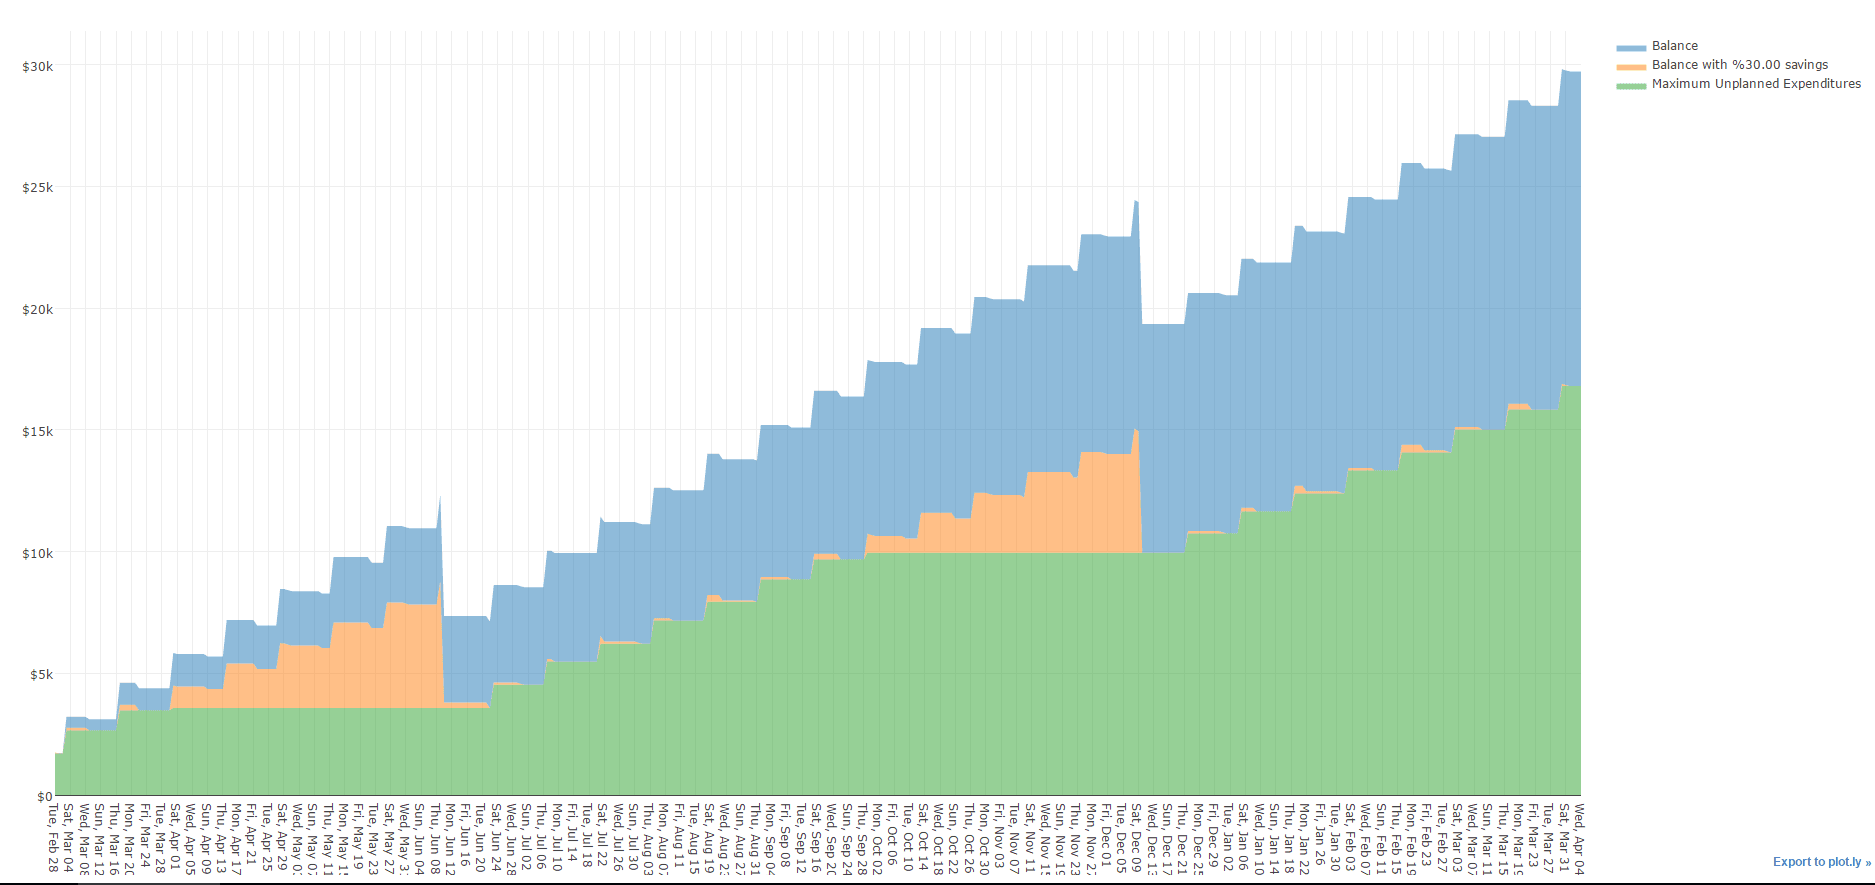
Graph of > 1 year worth of financial transaction projections. The blue graph represents the balance, the orange represents balance with a savings percentage (in this case %30), and the green represents the total amount possible to spend without hitting 0.
New features include:
- Filled graph with colors for extra spice
- Multiple graphs including maximum possible expenditures and savings percentages
- Labels to show exactly what charges come out when (using a given label when setting up the charges)
One of the issues I noticed after I generated this is that you need to generate a sufficient amount into the future to make sure that really far off charges aren't missed in the factors applied to the maximum possible expenditures graph.
As of now this solves my problem so I don't know if I'll need to add any more features. Perhaps if I ever have larger saving/investing goals.